Infographics
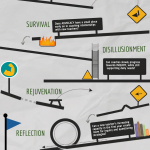
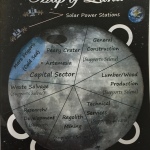
In my own classroom, the use of infographics has been a valuable tool to teach not only visual literacy, but graphic design. Our society is a visual one and students need to be prepared to not only interpret the meaning of visuals presented to them but to present their own visual stories back to others. Many already do this in some capacity on sites like Instagram, YouTube and Snapchat. Of course, creating an infographic does go beyond taking a selfie, requiring students to think very critically. Above are some infographics of mine that I’ve shared with students.
What is an infographic?
I tell my students that infographics (informative graphics) are a way to convey information to an audience in a simple, engaging way. I tell them that it is a way of storytelling. I tell them that it counters the notion, often seen in writing, that longer is better. I tell them that synthesis is truly the challenge here. The key to a successful infographic is a finished product that looks deceptively simple.
How do you use them in your teaching?
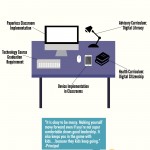
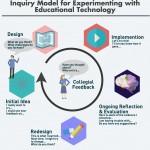
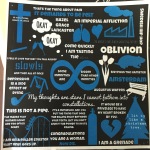
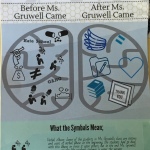
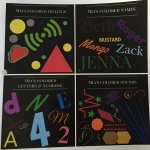
Each time I’ve presented this idea, I’ve been surprised by how many student haven’t heard the term infographic. They are, however, familiar with similar images in nonfiction books from their childhood. Students are often surprised by how much they can “read” from a visual image, as well as how quickly they can identify the relationships present, such as in flowcharts and cycles, etc. I often begin by showing students some examples and asking them to identify key elements. This is an important first step to pave the way for students to create their own. Infographics can be used as a creative alternative to a typical project or even writing assignment. Students can share them in a printed form or with each other online. In the examples below, my students use infographics to share elements of symbolism from novels they had recently read.

How do you make an infographic and not just a poster?
-
Get out of the habit of “go find and stick up” (Images are not stickers to place without thorough consideration.)
-
Viewer should be able to understand relationships at first glance (cross language barriers perhaps)
-
Overall imagery should be thematic or symbolic
-
Not just be content, but an analysis of this information
-
Does your infographic…tell a story? persuade? present an argument?
-
Consider the overall text structure (compare & contrast, sequence, cause & effect, etc.)
What tools do you use to create infographic?
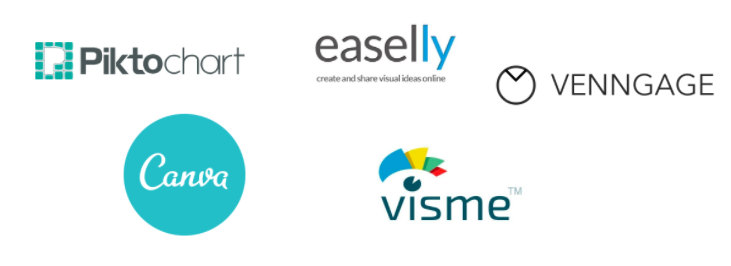
There are many, many online tools available that can make this process easy and fun for students. Some examples are shown above. Please note that some of these tools have both free and paid versions with varying customization options. Be warned that “go find and stick up” is tempting with these tools. Additionally, by no means is a fancy tool necessary to create such a visual image. A simple tool like Google Slides, Powerpoint or even pen and paper can work just as well!