Visual Literacy: Analyzing Infographics with Students

In my last post, I wrote about the use of infographics in the classroom. Their creation can be a powerful exercise in both visual literacy and graphic design. A far cry from the poster projects of my youth, infographics call on students to synthesize information and think thematically. Just because you present students with a great online infographic creation tool (Piktochart, Visme, etc.) doesn’t mean they are ready to create one. Many students are not even familiar with the term infographic (informative graphic). I start any lesson on the topic by asking students to analyze the work of others. This extra step yields far better results in students’ final work.

Questions to Ask Students

  • How do you read this image? From left to right?

  • How does the organization of information/text structure help an author and a reader establish important themes?

  • What do you see first? Why?

  • What stands out to you at second glance? Why?

  • Where does your eye travel?

  • What relationship is shown in this infographic? How do you know? What choices did the designer make to ensure this was clear, even from afar? How does this help you to read this information?

  • How is color used? What is bright and what is dull in color? Why do you think the creator chose to do this?

Students are amazed to realize that these design decisions are not haphazard, but purposefully considered by the author. 

"Bringing the Farm to School: Growing Healthy Children & Communities" by USDA is licensed under CC by 2.0.
“Bringing the Farm to School: Growing Healthy Children & Communities” by USDA is licensed under CC by 2.0.

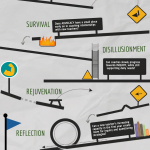
For example, consider the infographic above. A quick “read” yields some clear key aspects of this infographic’s design. Thematic imagery is used to convey the larger message (farm-to table practices are present in some U.S. schools). Even a cursory glance suggests that numbers and statistics are a focus. Color and font size also draw attention to these statistics. This infographic is designed to highlight the successes of current farm-to-table eating in schools, rather than challenges. One may even notice that the sizes of the grocery bags decrease to coincide with the percentages represented on them. While this is far from a complex infographic, it is successful in presenting synthesized information about the topic. It is  also clear that graphic design elements are purposeful and on-message. You may think these simple elements are innately obvious, but it is useful to model your thinking and work with students to unpack these design choices as they relate to theme and message. Finally, I encourage teachers to survey students for topics of interest before choosing an infographic to study together. This will create further engagement and interest with students.

Using Infographics in the Classroom

Infographics

In my own classroom, the use of infographics has been a valuable tool to teach not only visual literacy, but graphic design. Our society is a visual one and students need to be prepared to not only interpret the meaning of visuals presented to them but to present their own visual stories back to others. Many already do this in some capacity on sites like Instagram, YouTube and Snapchat. Of course, creating an infographic does go beyond taking a selfie, requiring students to think very critically. Above are some infographics of mine that I’ve shared with students.

What is an infographic?

I tell my students that infographics (informative graphics) are a way to convey information to an audience in a simple, engaging way. I tell them that it is a way of storytelling. I tell them that it counters the notion, often seen in writing, that longer is better. I tell them that synthesis is truly the challenge here. The key to a successful infographic is a finished product that looks deceptively simple.

How do you use them in your teaching?

Each time I’ve presented this idea, I’ve been surprised by how many student haven’t heard the term infographic. They are, however, familiar with similar images in nonfiction books from their childhood. Students are often surprised by how much they can “read” from a visual image, as well as how quickly they can identify the  relationships present, such as in flowcharts and cycles, etc. I often begin by showing students some examples and asking them to identify key elements. This is an important first step to pave the way for students to create their own. Infographics can be used as a creative alternative to a typical project or even writing assignment. Students can share them in a printed form or with each other online. In the examples below, my students use infographics to share elements of symbolism from novels they had recently read.

How do you make an infographic and not just a poster?

  • Get out of the habit of “go find and stick up” (Images are not stickers to place without thorough consideration.)

  • Viewer should be able to understand relationships at first glance (cross language barriers perhaps)

  • Overall imagery should be thematic or symbolic

  • Not just be content, but an analysis of this information

  • Does your infographic…tell a story? persuade? present an argument?

  • Consider the overall text structure (compare & contrast, sequence, cause & effect, etc.)


What tools do you use to create infographic?

screen-shot-2017-04-26-at-10-23-53-am

There are many, many online tools available that can make this process easy and fun for students. Some examples are shown above. Please note that some of these tools have both free and paid versions with varying customization options. Be warned that “go find and stick up” is tempting with these tools. Additionally, by no means is a fancy tool necessary to create such a visual image. A simple tool like Google Slides, Powerpoint or even pen and paper can work just as well!

ISTE Student 3: Digital Independence in the Classroom

Choice can have a significant impact on student learning. It maintains engagement and drives a desire for inquiry. O’Connor and Sharkey (2013) shared in “Establishing Twenty-First-Century Information Fluency” that the performance of students is at its peak when learning is individualized (p. 35). However, in offering student choice of technology, one of my challenges as an educator has been challenging students who tend to repeatedly gravitate towards the same digital tools. My direct instruction has encouraged students to use various new tools, however this approach is seemingly unsustainable. Instead, students can be guided to find their own digital tools, as outlined in ISTE 3, which is the focus this week’s post. I also encourage you to check out past two posts, exploring ISTE 1 and 2. ISTE 3 states that students should be able to evaluate and select digital tools based on the appropriateness to specific tasks. This shift towards individualized and student-driven learning is reiterated in 21st century skills, which states that a students should be able to judge the effectiveness and impact of various technologies. The Common Core Standards also outline that students should be able to critically navigate and evaluate media. This type of information fluency is a key component of cultivating early adopters of innovative technologies.

As educators we can “innovate pedagogically to help students develop a high level of aptitude to interact fluently with both information and technology” (O’Connor, L., & Sharkey, J., 2013, p. 33). Our ability to innovate might at times be aided by the digital tools we chose to implement. Unfortunately, I have often assumed that quality instruction requires the mastery of digital tools prior to sharing it with my students. While technological aptitude is a necessary part of being an educator, innovation in the classroom comes in the form of allowing student-driven evaluation and choice (Dooley, 1999, p.38). A student’s ability to discriminate between useful and useless resources is also a necessary career skill. And, as Bates (n.d.) writes about in Teaching in the Digital Age, learning by doing allows for reflection, understanding, and experience. We need to give students the opportunity to practice these decision-making skills.

Continue reading